
User testing is a critical part of the product design process. In this tutorial you’ll learn how to test prototypes using Figma and Useberry, the highest rated UI design tool and the highest rated user testing tool, respectively, according to the 2021 Design Tools Survey.
Note: Alternative combinations of tools such as Sketch + Maze will also work, since the workflows are very similar.
Let’s begin.
Step 1: Import Your Figma Prototype Into Useberry
We’ll start by using the Useberry plugin for Figma to import your Figma prototype into Useberry.
In Figma, navigate to “Resources” (shift + I) and then “Plugins.” Type “Useberry” into the search field, then select it from the list of results to open the plugin window.
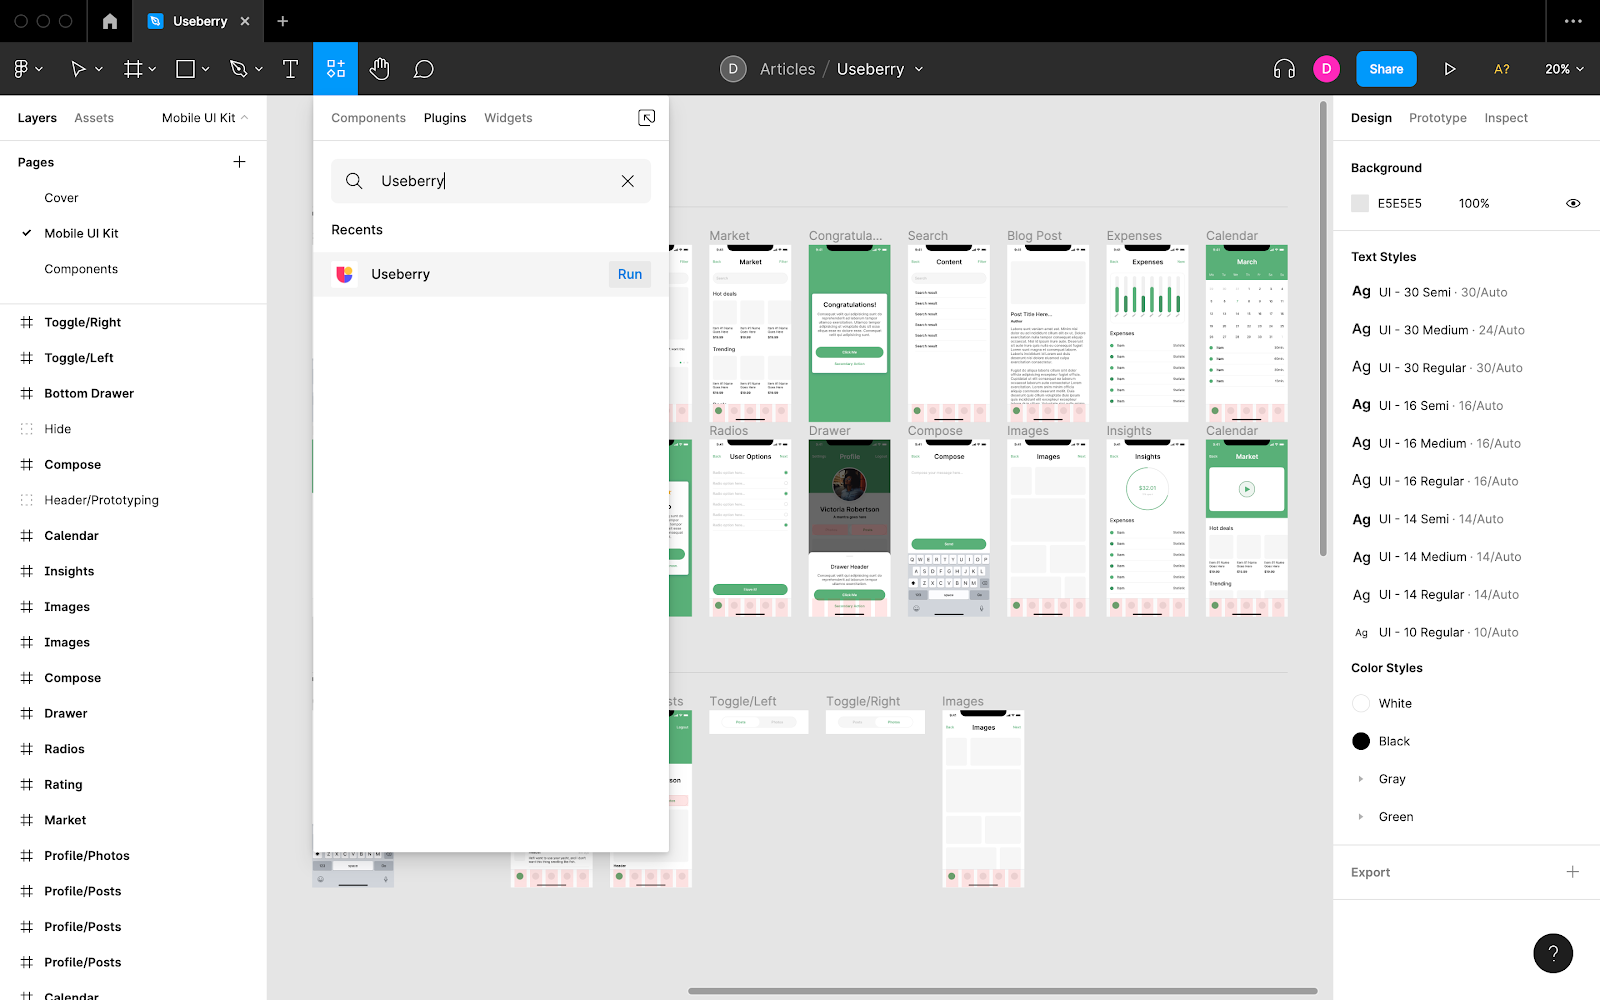
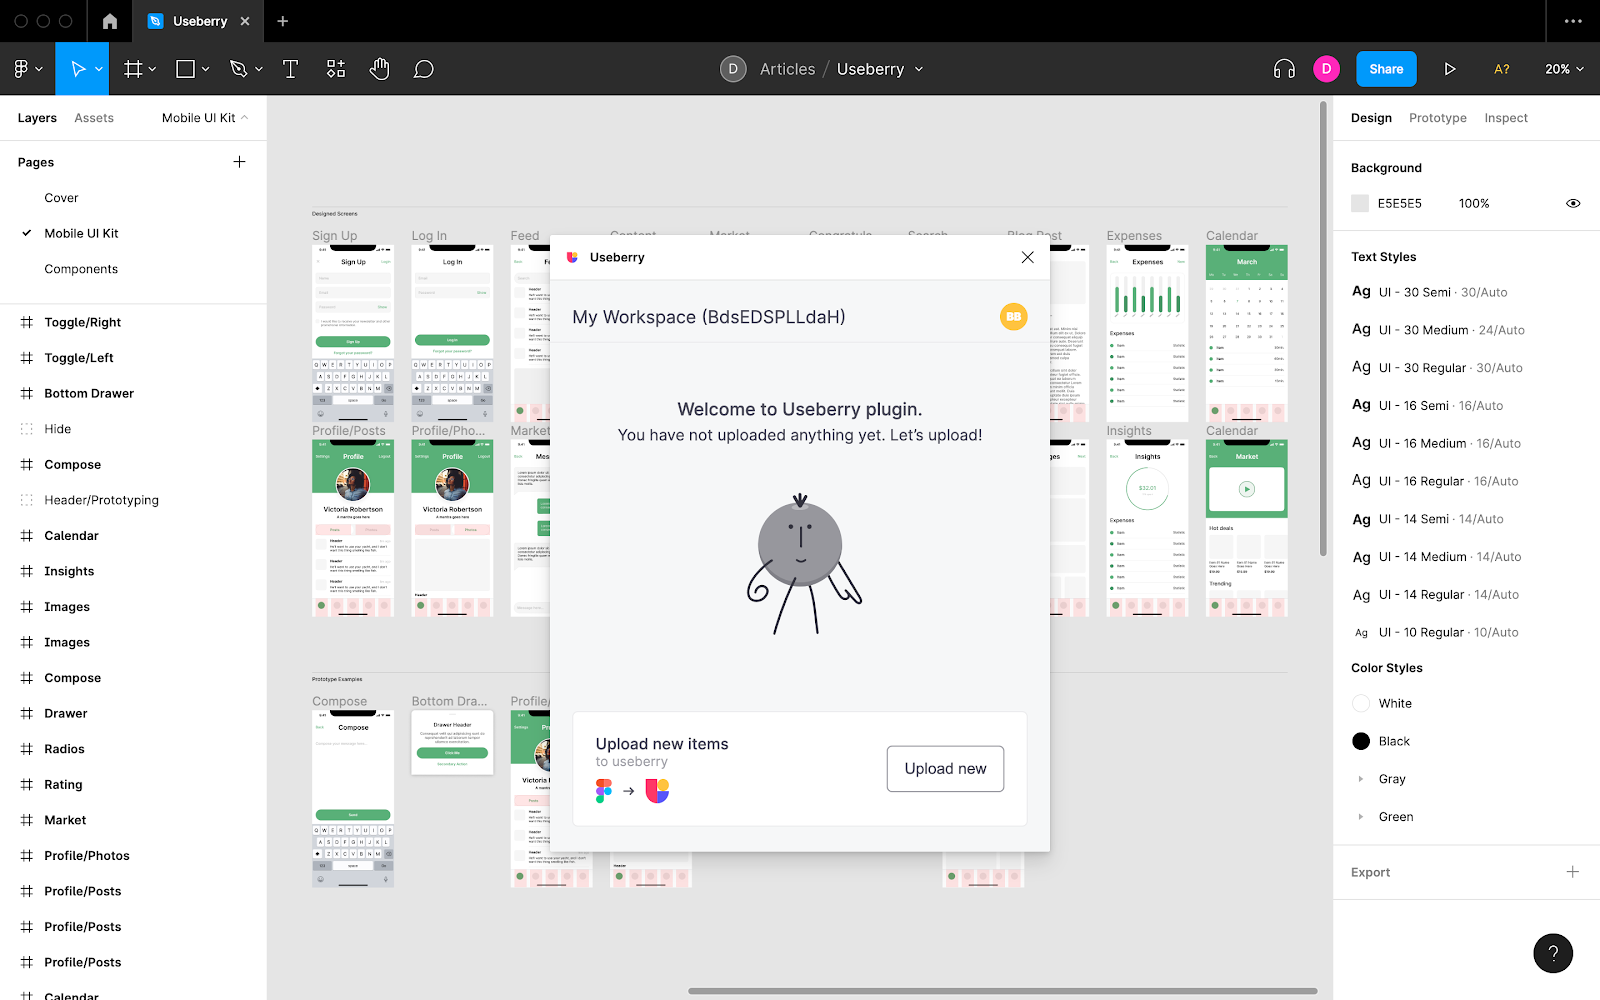
After logging into Useberry from the plugin window, click the “Upload new” button.
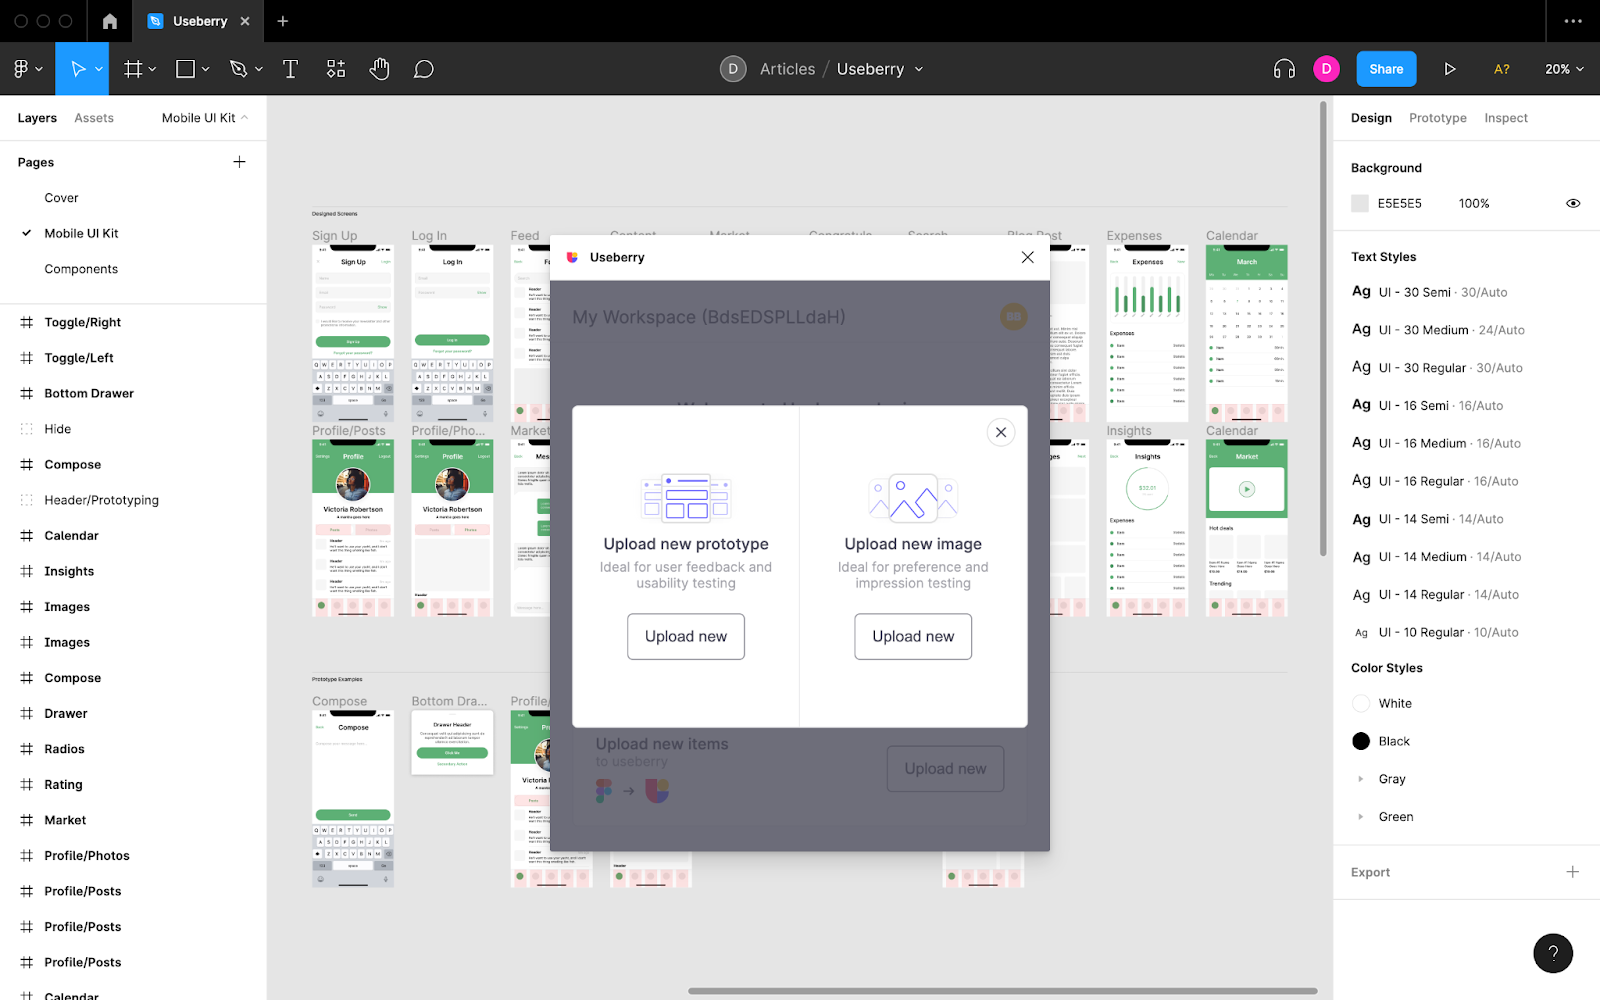
After that, you’ll have the option to either upload a new prototype (ideal for user and usability testing) or a new image (ideal for preference and impression testing). For this tutorial, choose the prototype option.
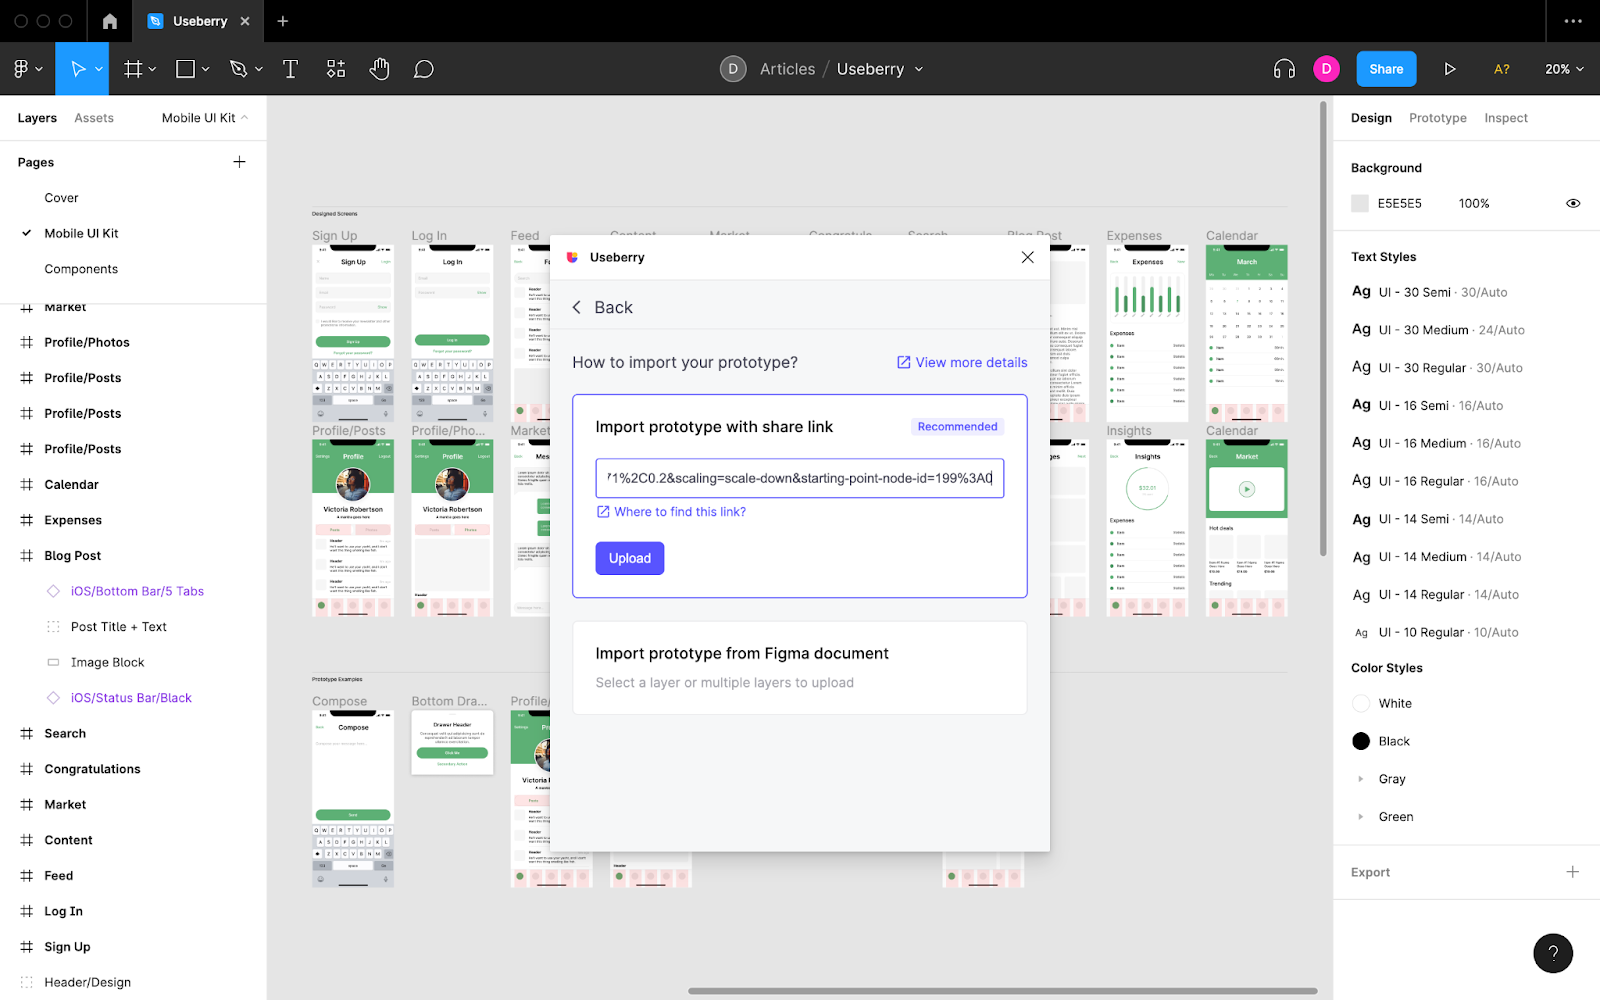
Next, you’ll need to decide how to import the prototype into Useberry (share link or layer selection). Use the share link method if you’d like interactions to remain intact in Useberry.
Choose an option, then follow the on-screen instructions.
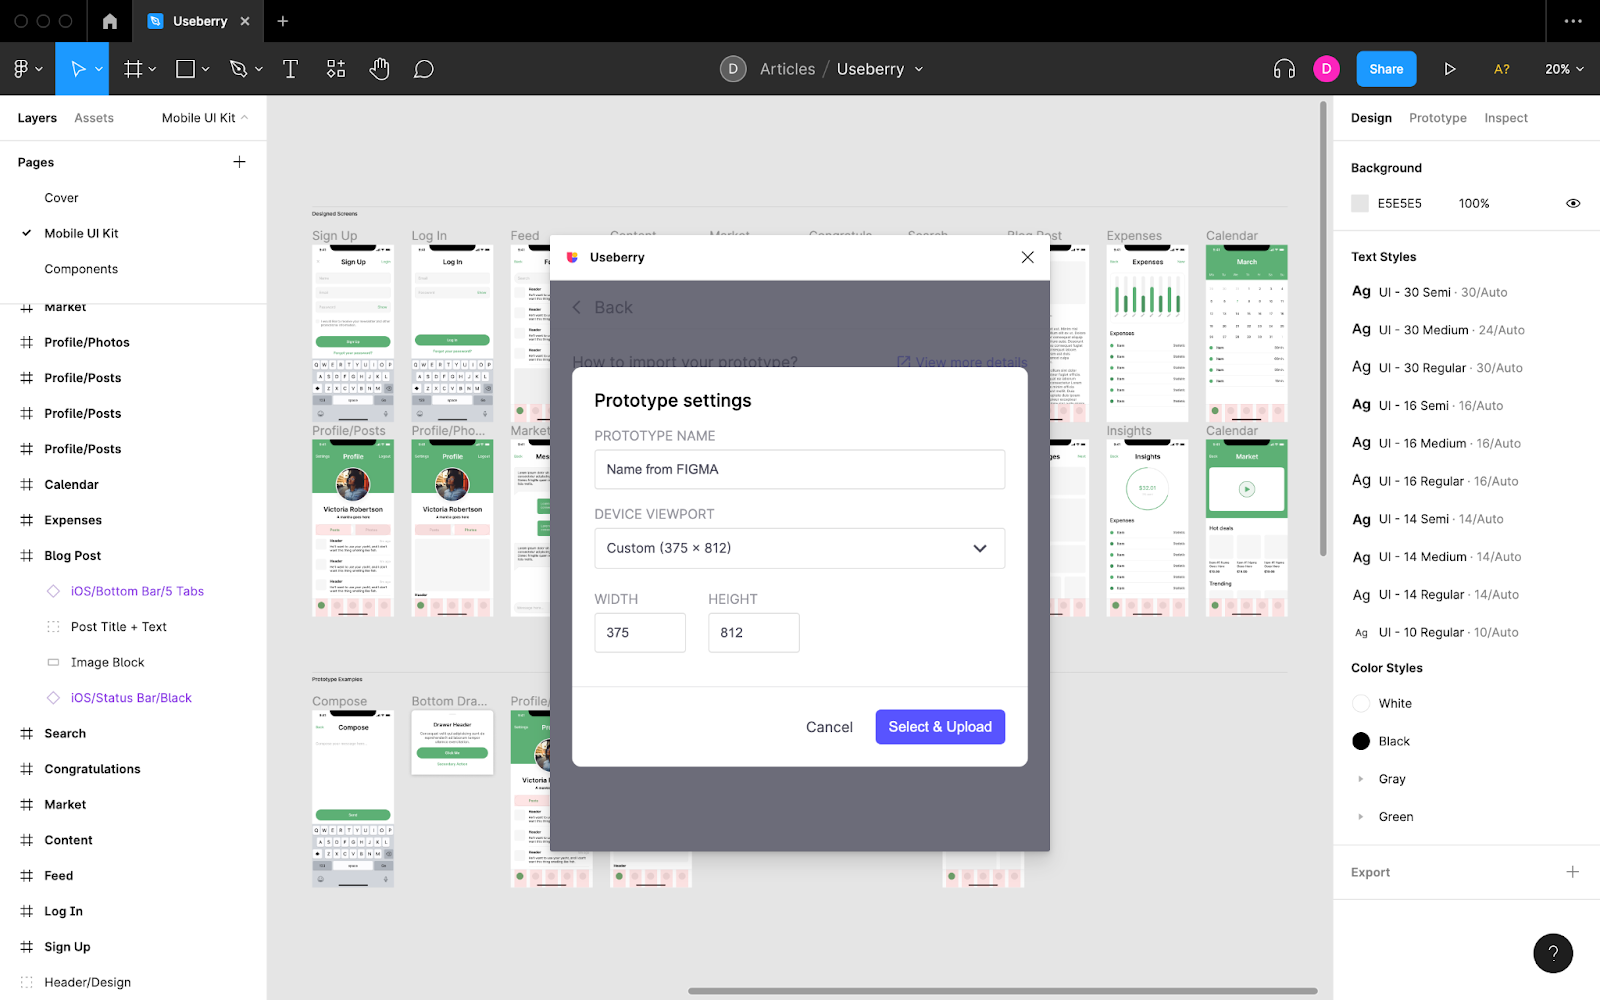
Confirm the name and dimensions of the prototype before clicking on the “Select & Upload” button.
Step 2: Create a Test in Useberry
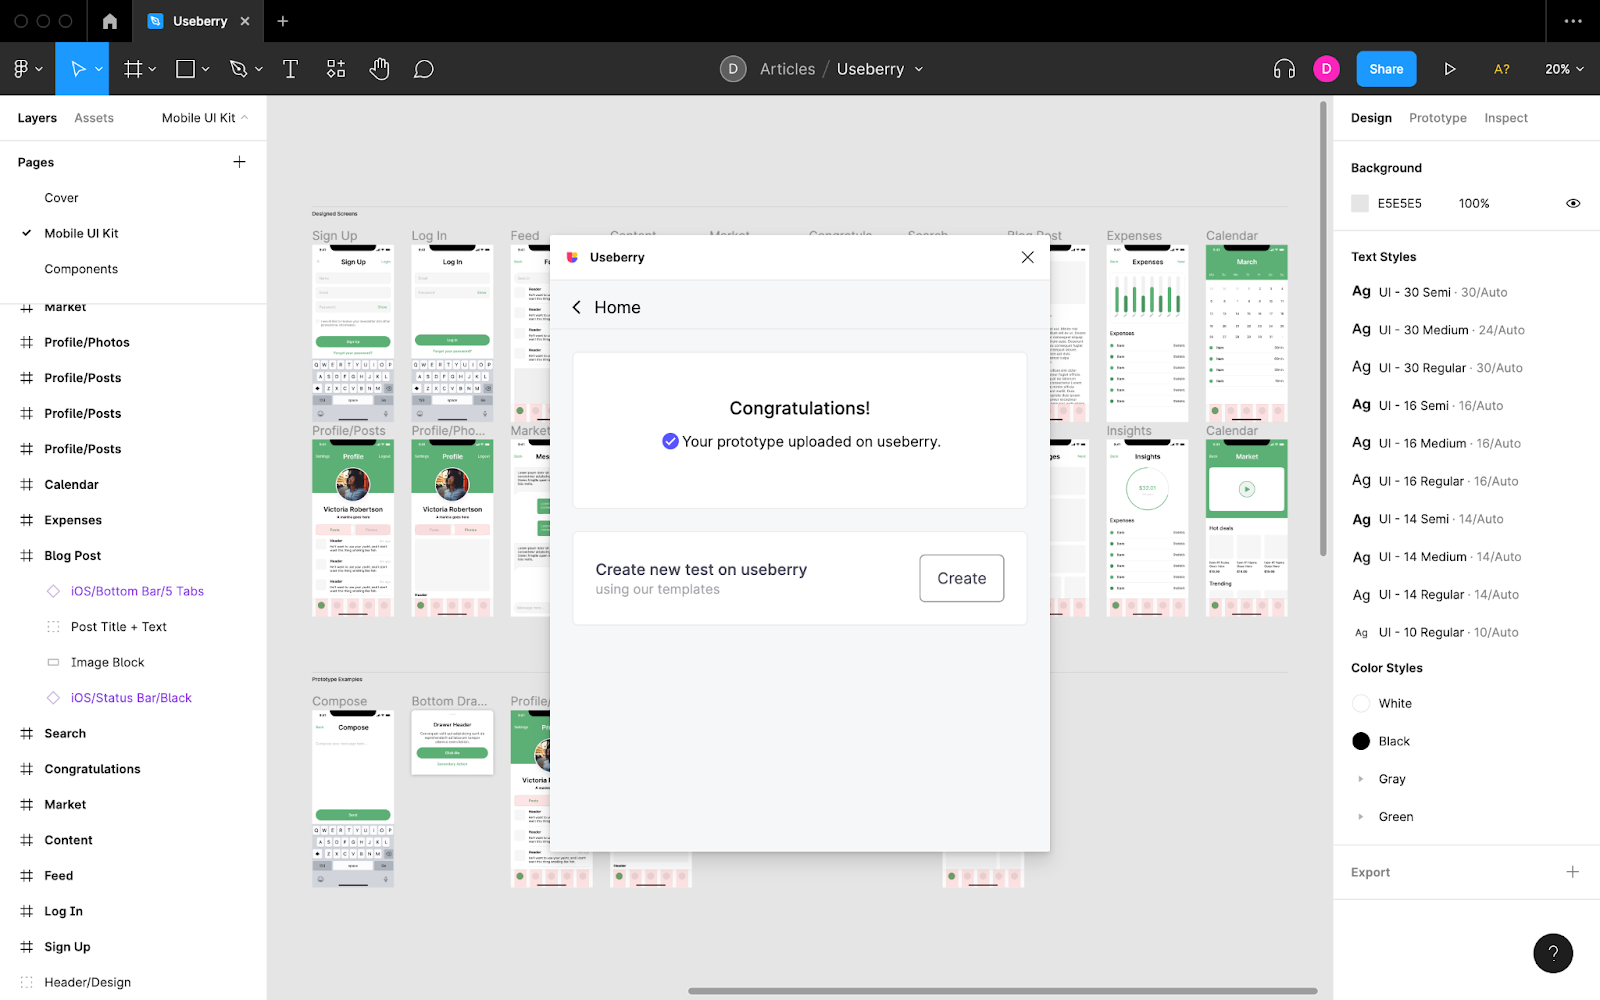
While still in the plugin window, click “Create” to begin creating a new test (or study) in Useberry. This will take you to the Useberry web app.
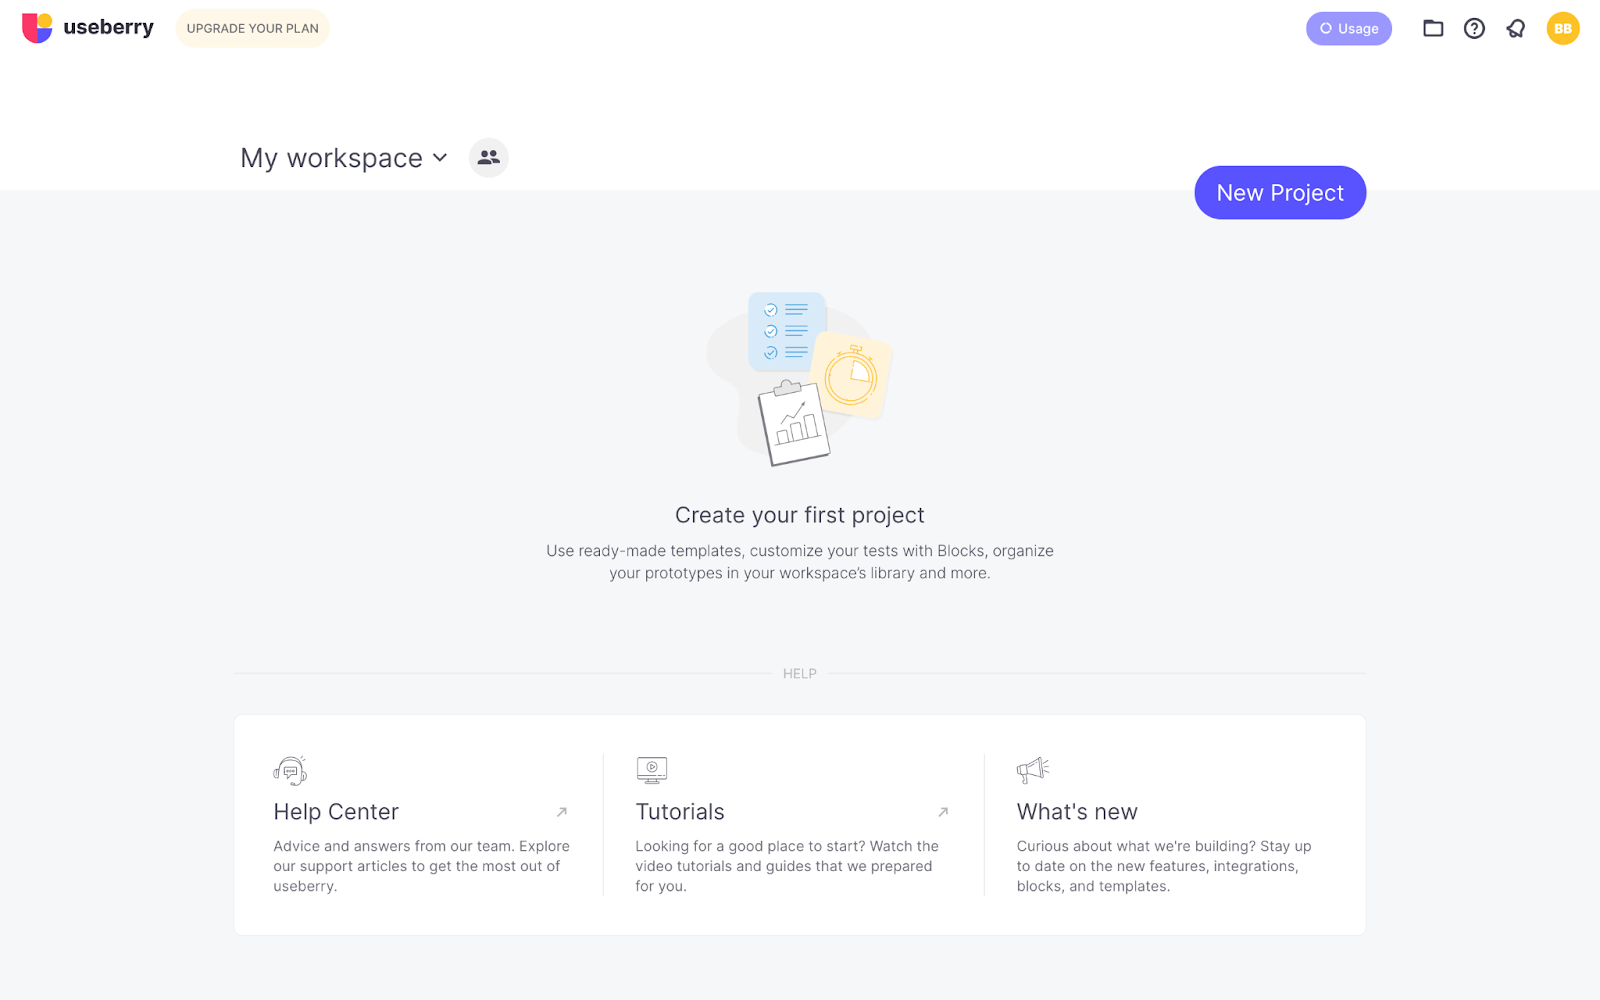
In Useberry, click “New Project.”.
At this point, you should be presented with a selection of user tests and studies. For this tutorial, choose “Single Task” (a popular test used to qualitatively and quantitatively evaluate how well users are able to carry out a task on a prototype).
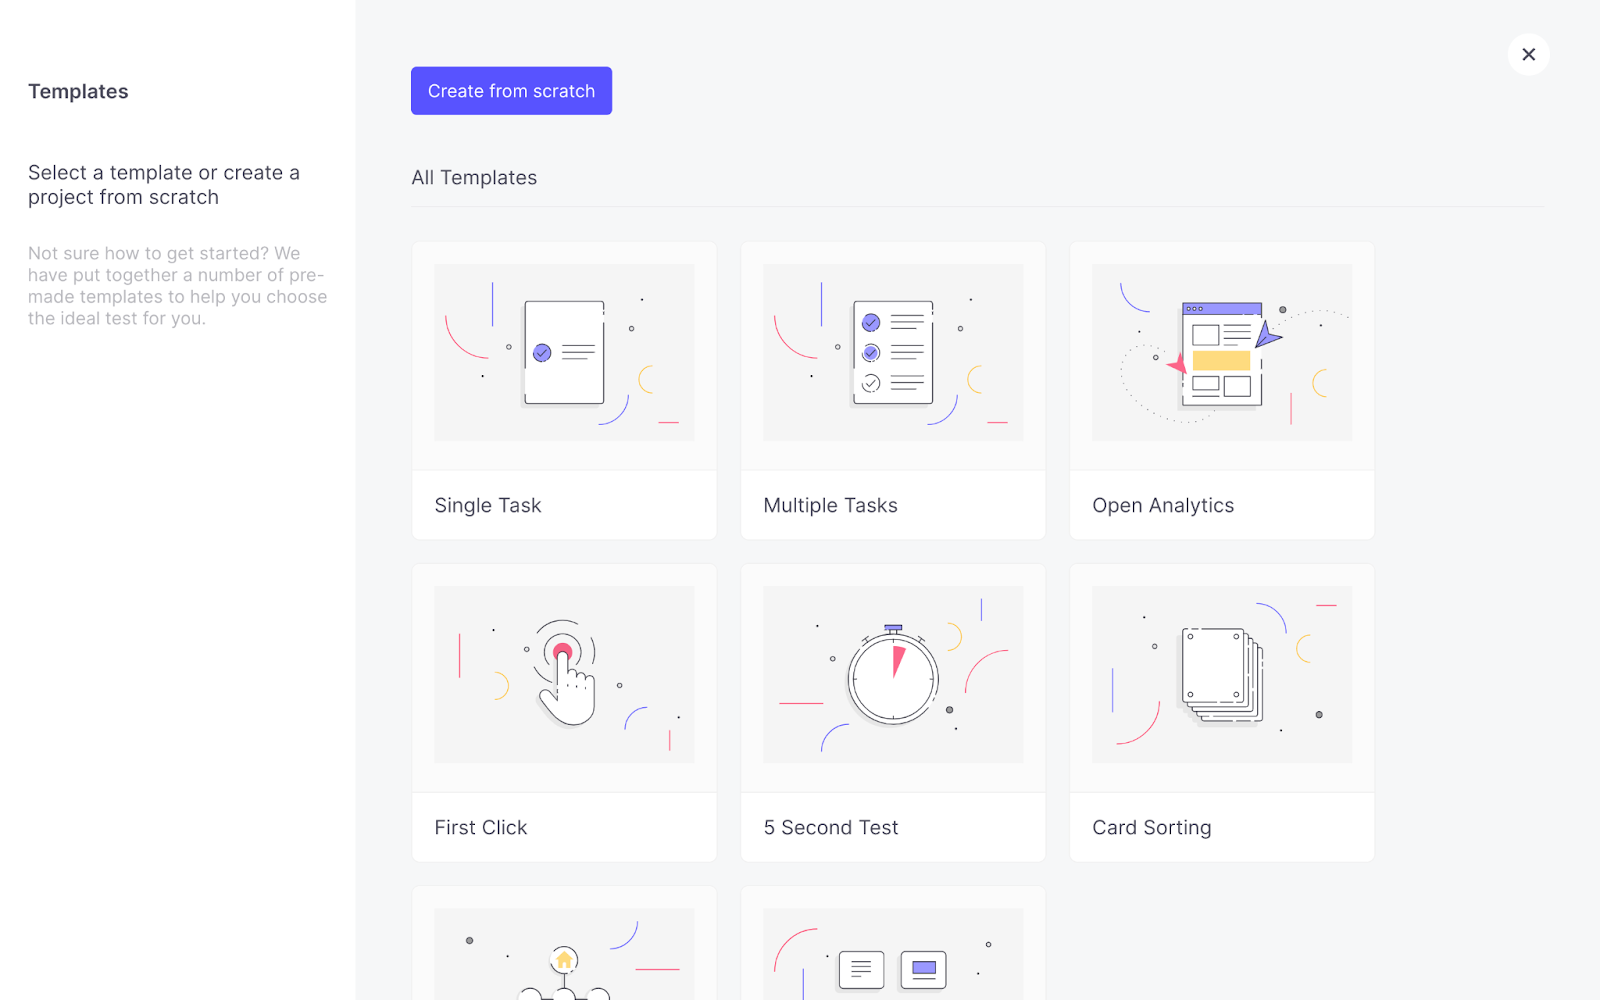
Other types of user tests and studies include:
- Multiple Tasks
- Open Analytics (observe what users do with the freedom to do anything)
- First Click (see if users are able to find something on a page)
- 5- Second Test (find out what users remember about a page after seeing it for only five seconds)
- Card Sorting (let users label and group navigation items in a way that makes sense to them)
- Tree Test (see if users are able to find something within a diagram of a navigation)
- Preference Test (given multiple options, see which option users prefer)
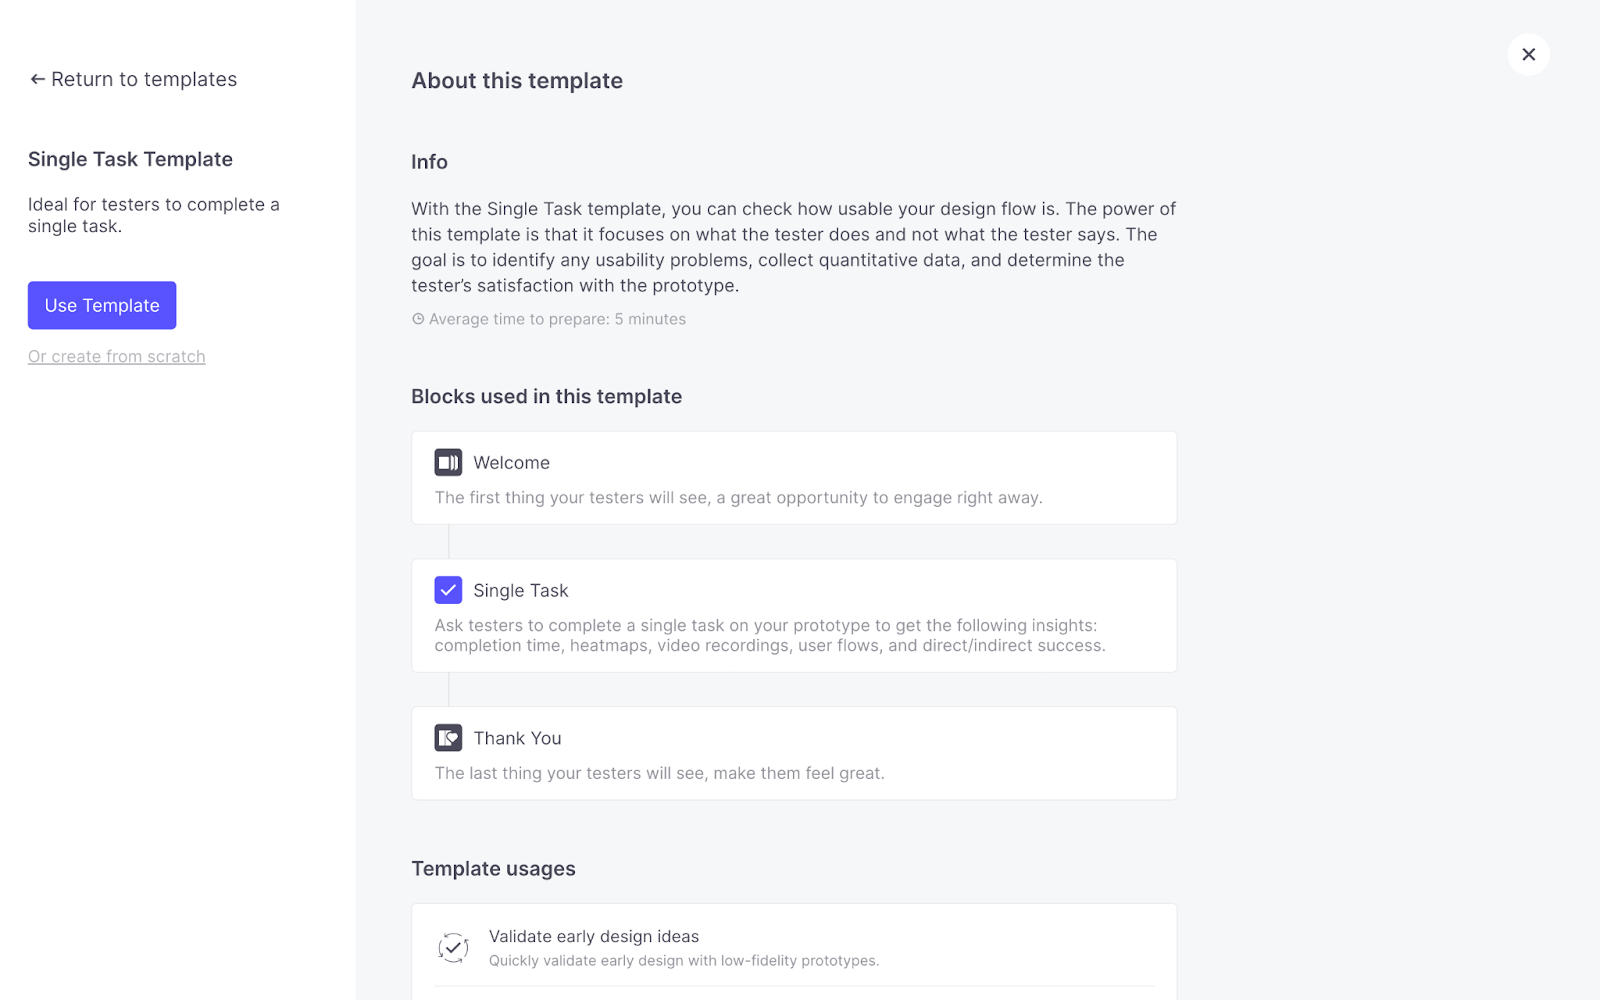
Next, you’ll be presented with the test’s' template. This outlines what the test is useful for, how long it takes to set up, and what users will see when they take the test. Click “Use Template” when you’re ready to move forward.
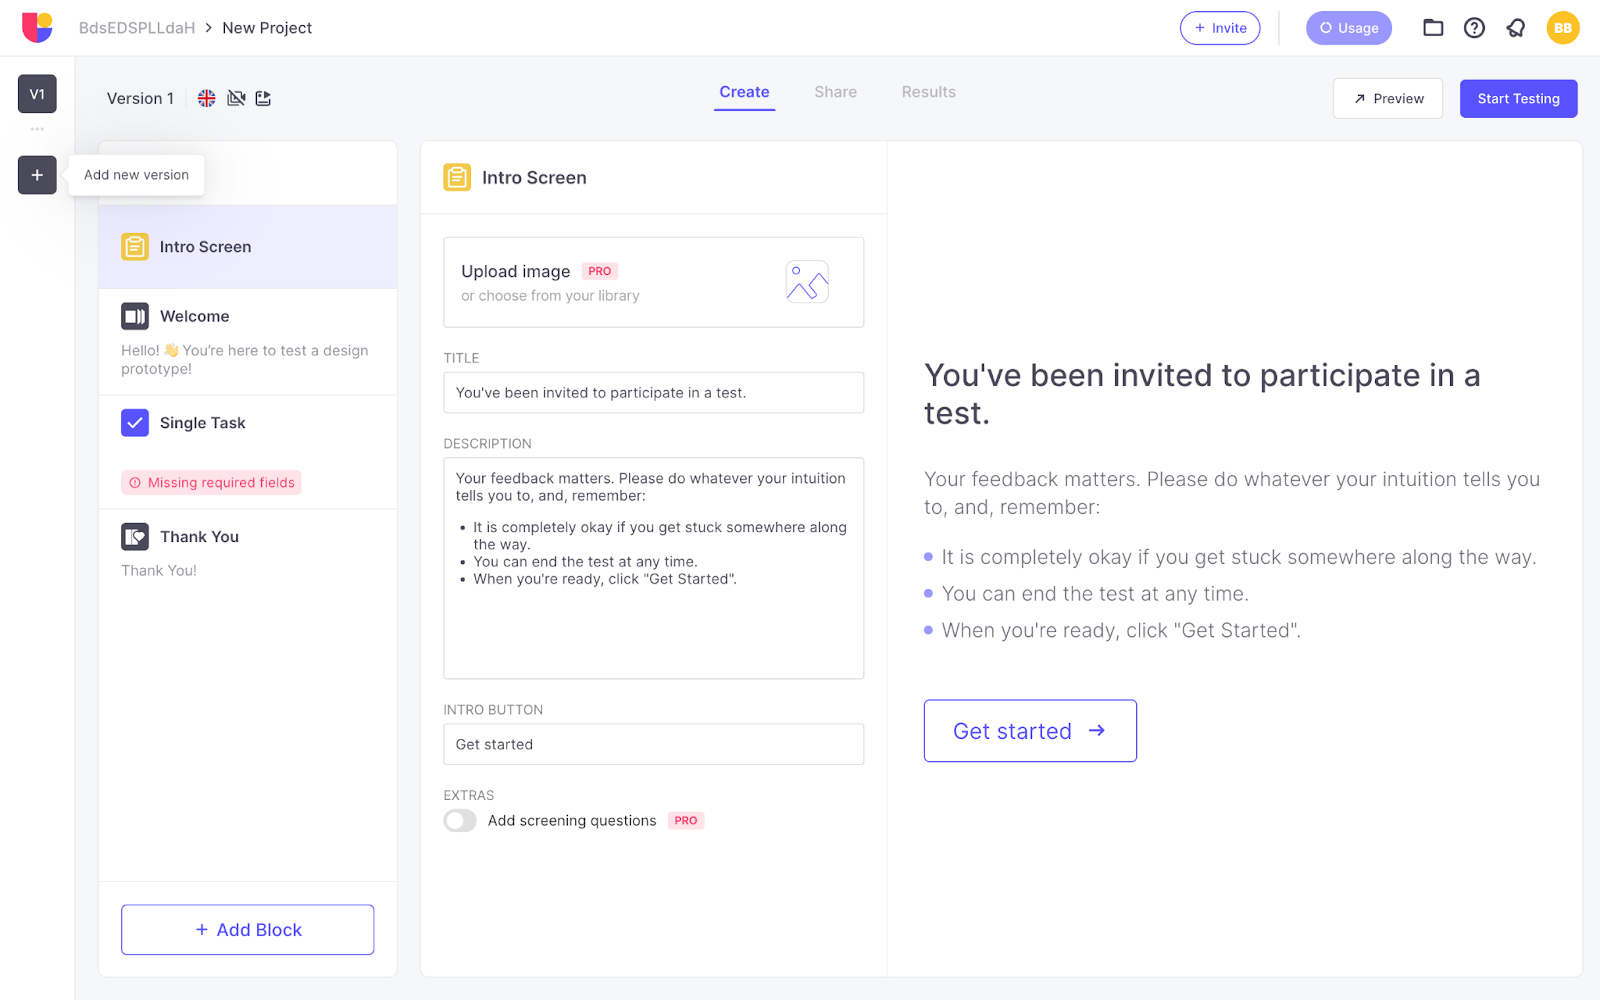
Now, it’s time to customize the template.
By default, you’ll be in the “Create” tab. This is where you’ll be able to edit the introduction (which can include screening questions, if you’d like to add any), the welcome message (which can be used to set expectations), the task that you’d like users to attempt and the thank you message at the end. These settings appear on the left, and a preview appears on the right so you can see exactly what users will see.
Customize the template to your needs and choose the Figma prototype that we imported when asked to do so.
Click “+ Add Block” if there’s anything else you’d like to add, such as a legal disclaimer. You can also click “+”/“Add new version” (top left corner) to test two versions at once (i.e. A/B testing) to see which one performs better.
When you’re ready, click on the “Share” tab to begin sharing the test with your participants.
Step 3: Share the Test
Once in the “Share” tab, click on the “Grab your link” button. This will open up a modal where you’ll be able to activate the test by clicking on the “Link active” toggle, optionally add custom variables (for tracking) and specify which types of devices users will be allowed to use and whether or not they’ll be able to complete the test more than once.
Tests can be embedded into websites, if you choose that option (near the bottom of the modal). However, if you only want to share the test URL, click “Copy” and then send the test URL to whomever, however.
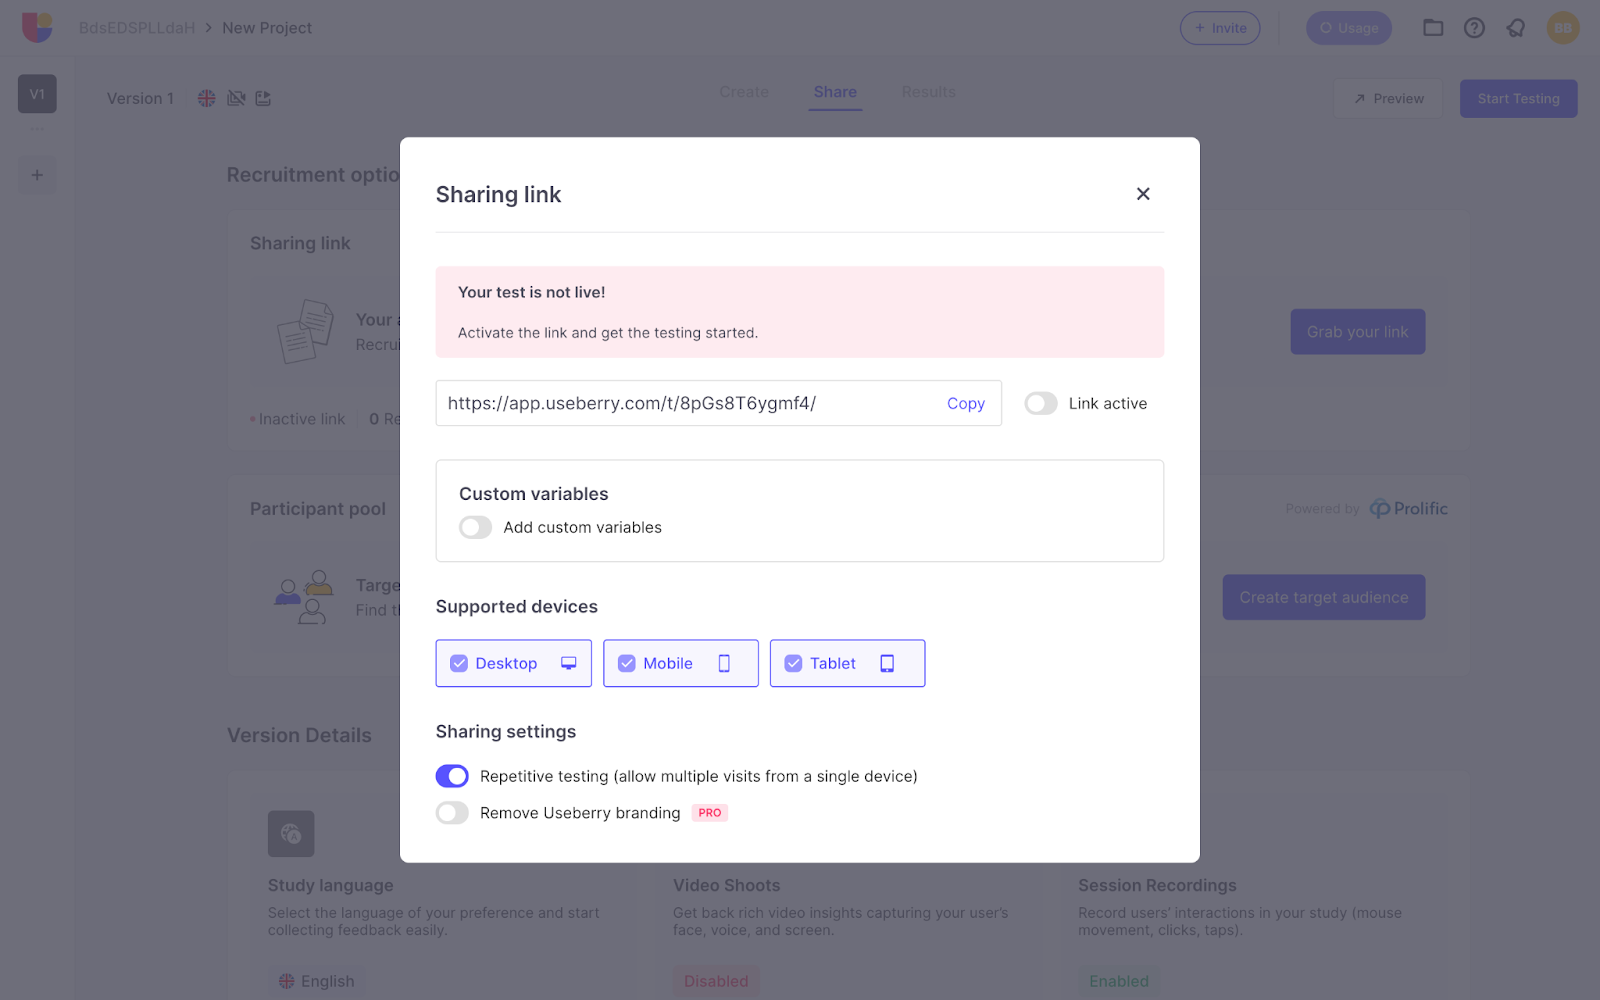
Note: if you don’t have any participants yet, you can select “Create target audience” from the previous screen to recruit some. This is powered by Prolific.
Step 4: Analyze the Results
To begin analyzing the results, click on the “Results” tab. Naturally, the types of data shown will depend on the type of test or study that you’re running. For example, Single Task results will reveal heatmaps and video recordings of users’ sessions, drop-off points and completion rates/times (and allow you to segment participants by these metrics too).
Pro users can also capture face and voice.
Step 5: Organize the Results
To share the results with stakeholders, simply copy the URL in the address bar (this works with specific segments too).
If you’re using a tool to track design and development issues (e.g., Jira), you can attach research findings to corresponding issues to keep stakeholders informed of their status and whether they’re ready for research, synthesis, redesign, handoff or implementation.
When changes are ready, use Sympli to acquire stakeholder feedback (alternatively or in addition to user feedback) and handoff designs. For a better issue tracking and handoff workflow, connect Jira to Sympli to display Jira issues alongside Sympli handoffs and bring Sympli handoffs into Jira.
You’ll end up with a setup where issues, user research, stakeholder feedback and handoffs are all in one central location — a complete and efficient product management workflow.