
What is a journey map?
A journey map is a way to visualise all the touch-points a customer or user takes on the way to completing a task. This could be to sign up for your product, upload a photo or buy a new chair.
In its basic form, a journey map is simply a series of user actions that have been sorted into a linear timeline of events. This timeline is then expanded upon to include user thoughts and emotions, this creates a visual representation of a narrative. Journey maps are best suited to scenarios that involve multiple steps and can cover multiple channels such as email, website and in-app.
What do journey maps look like?
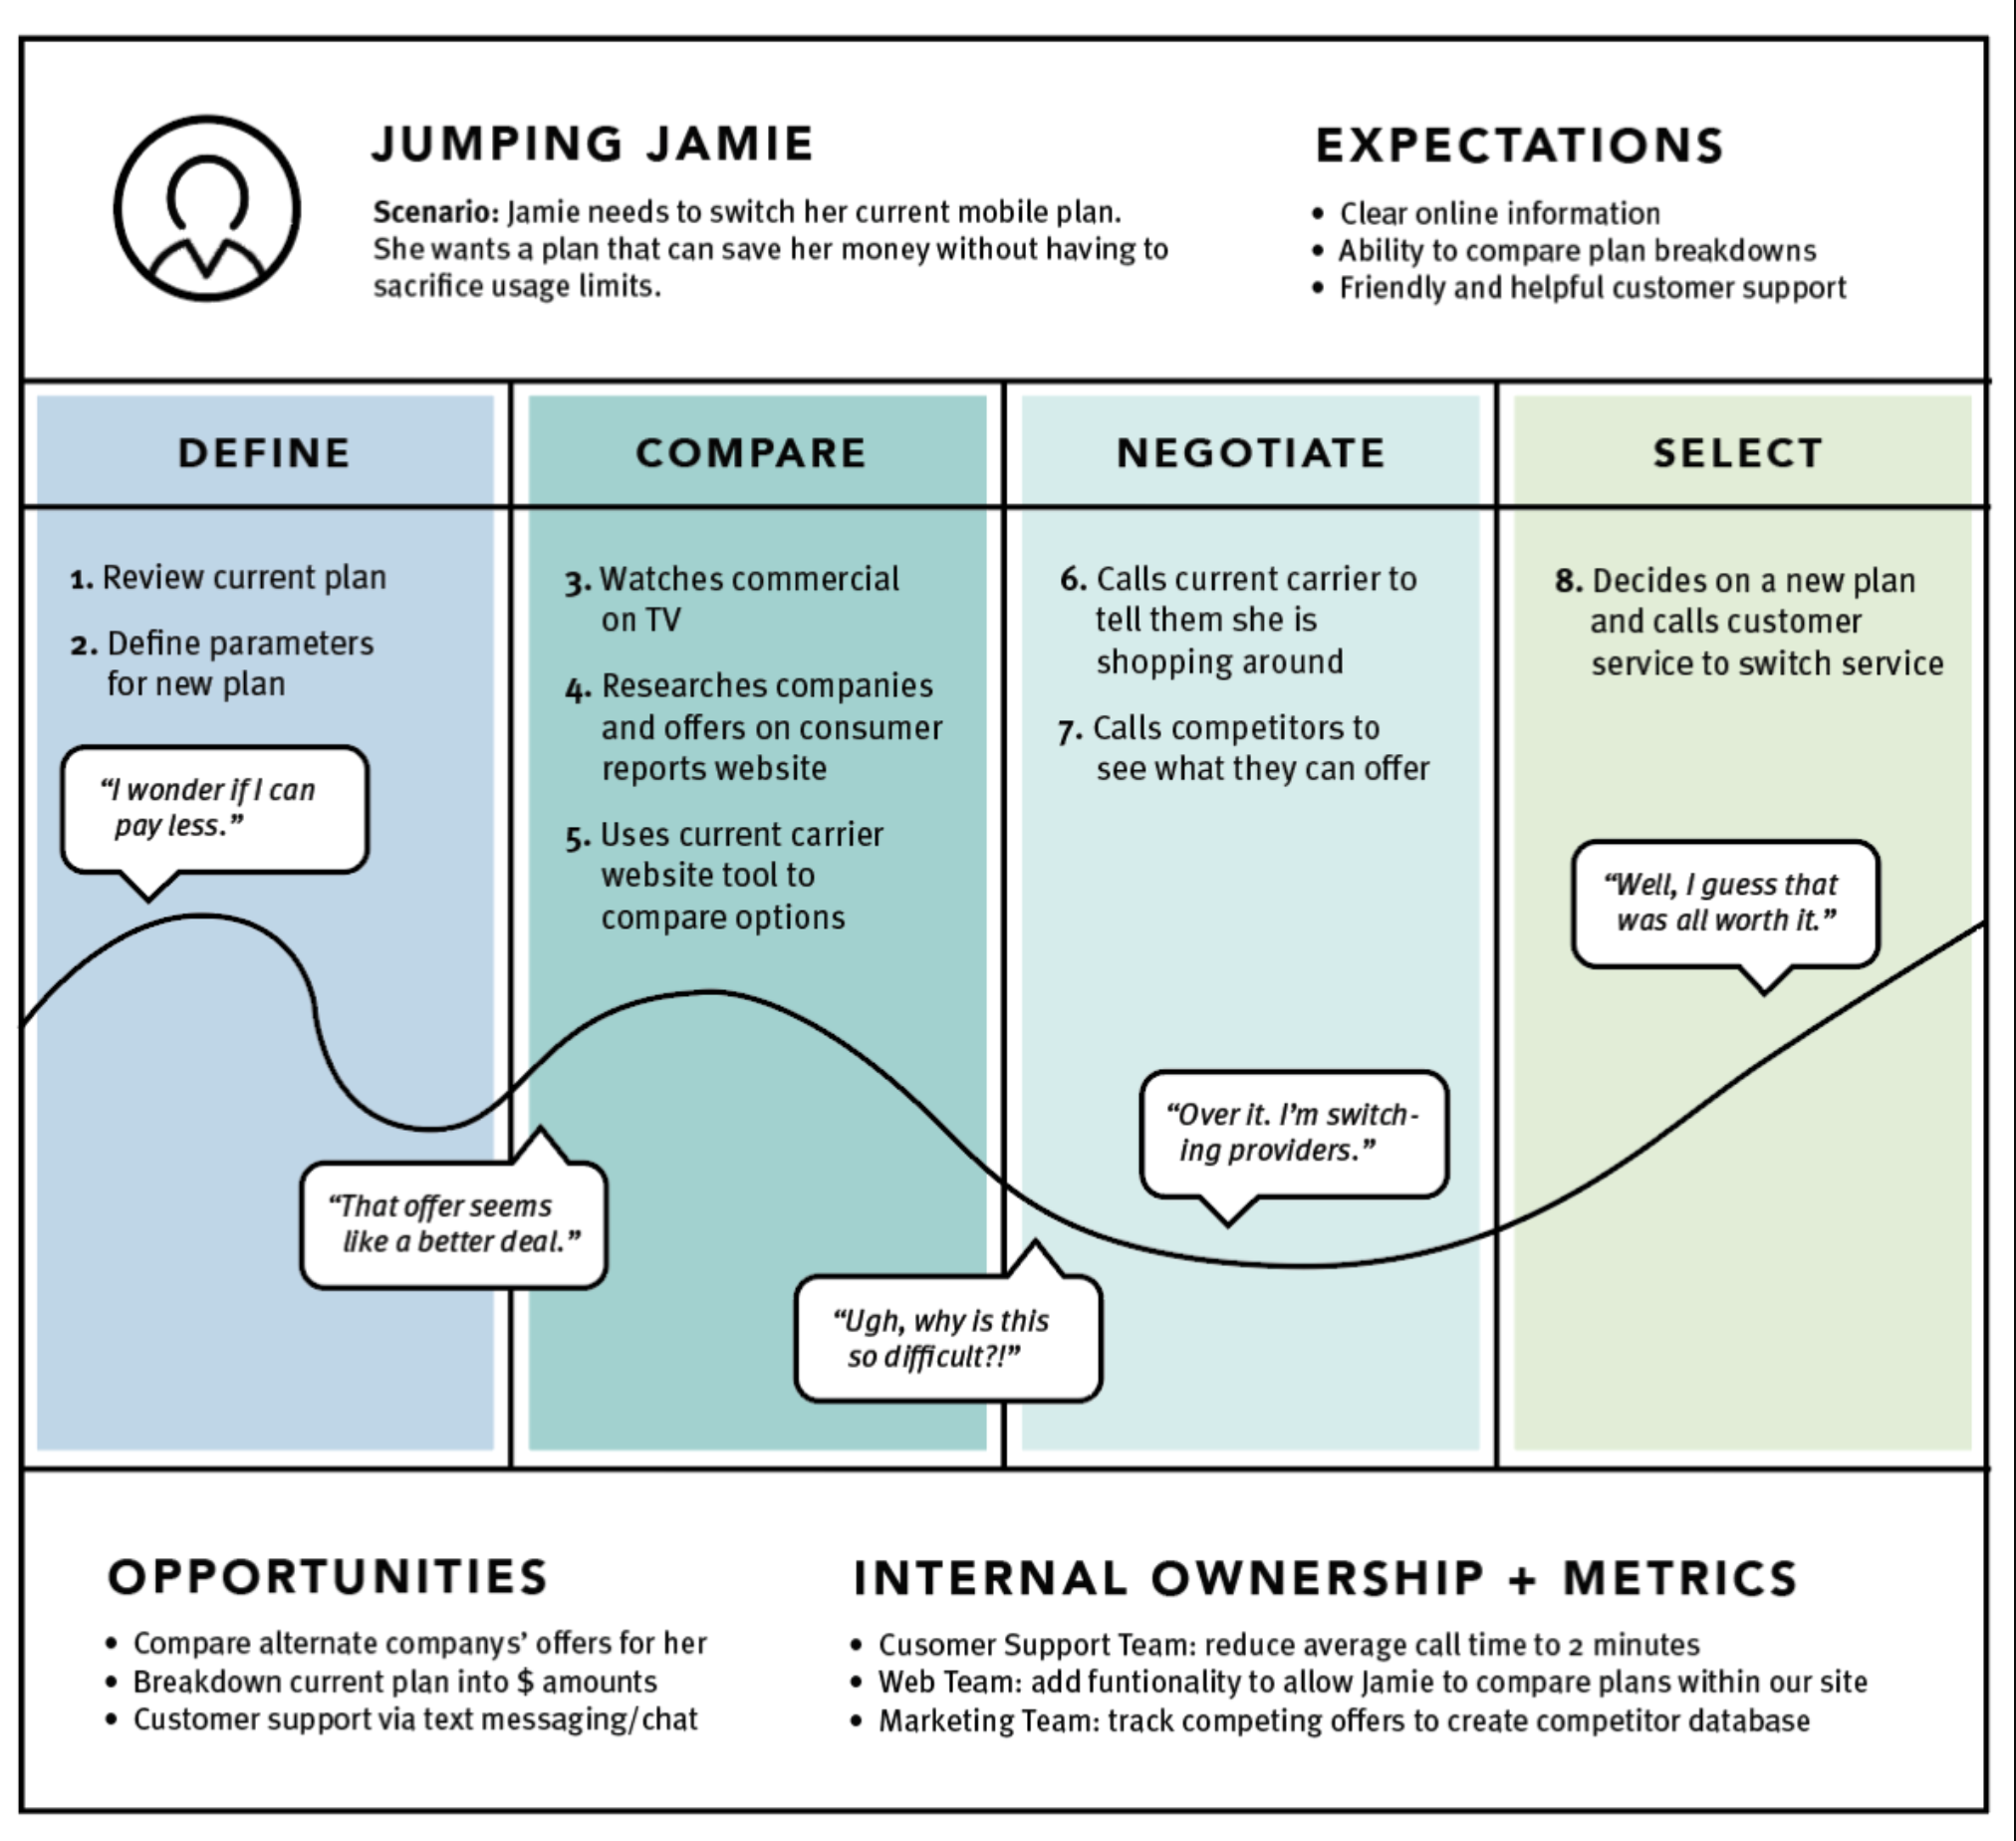
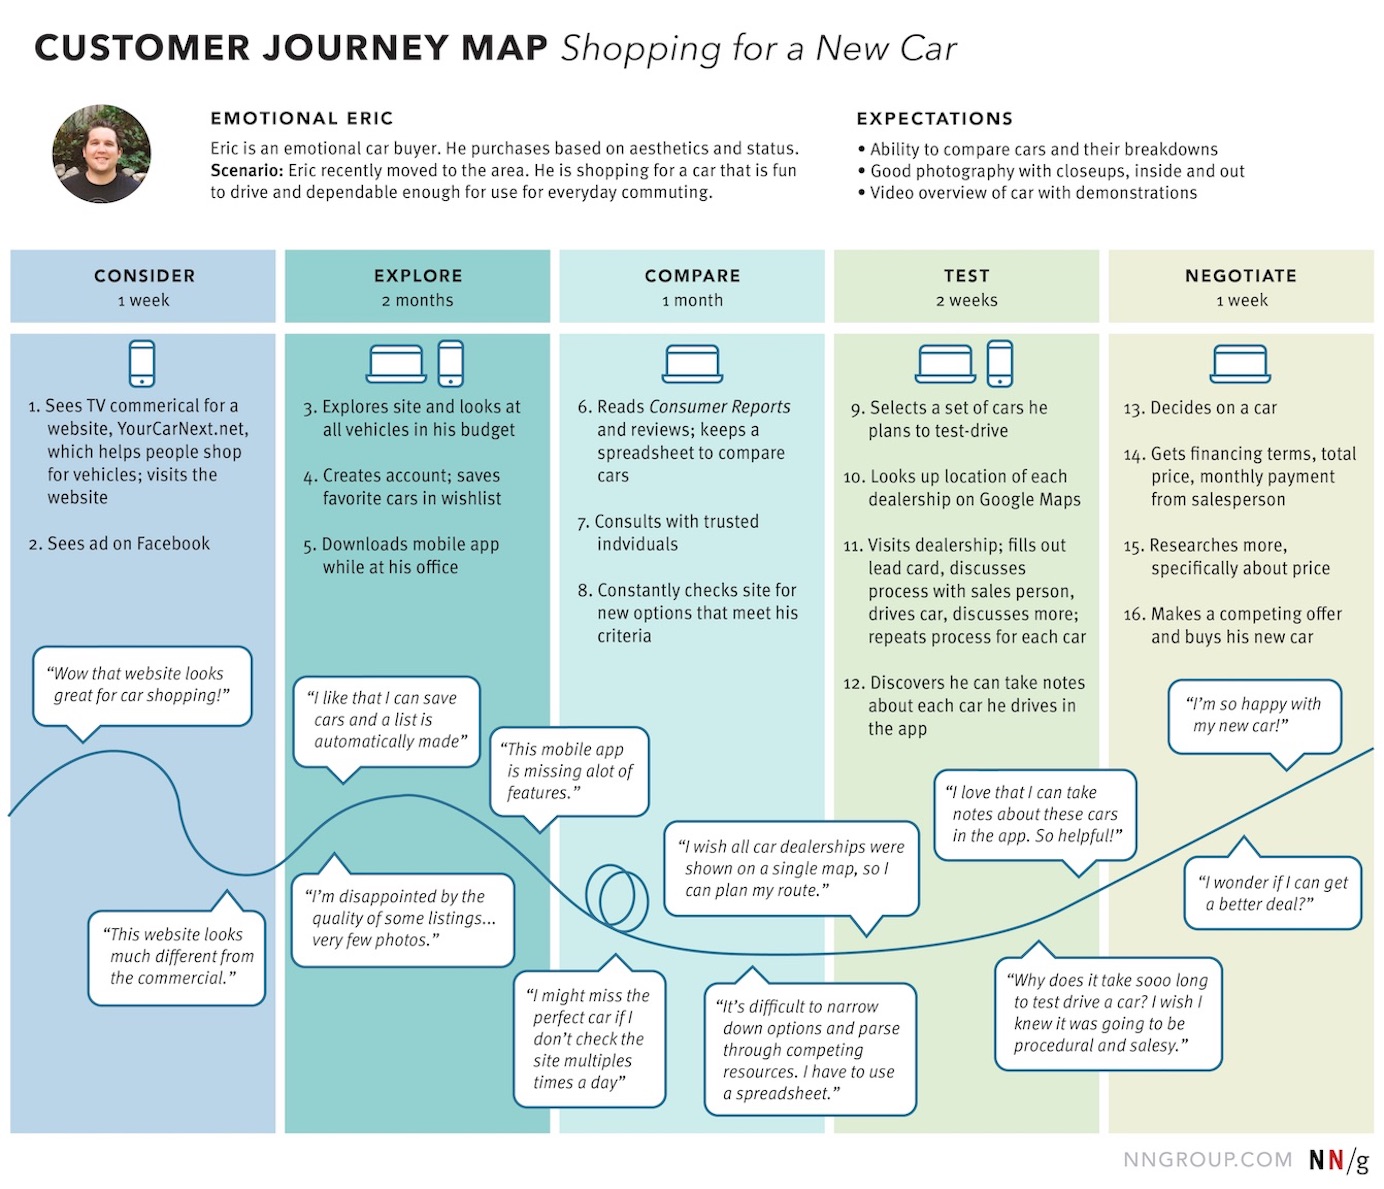
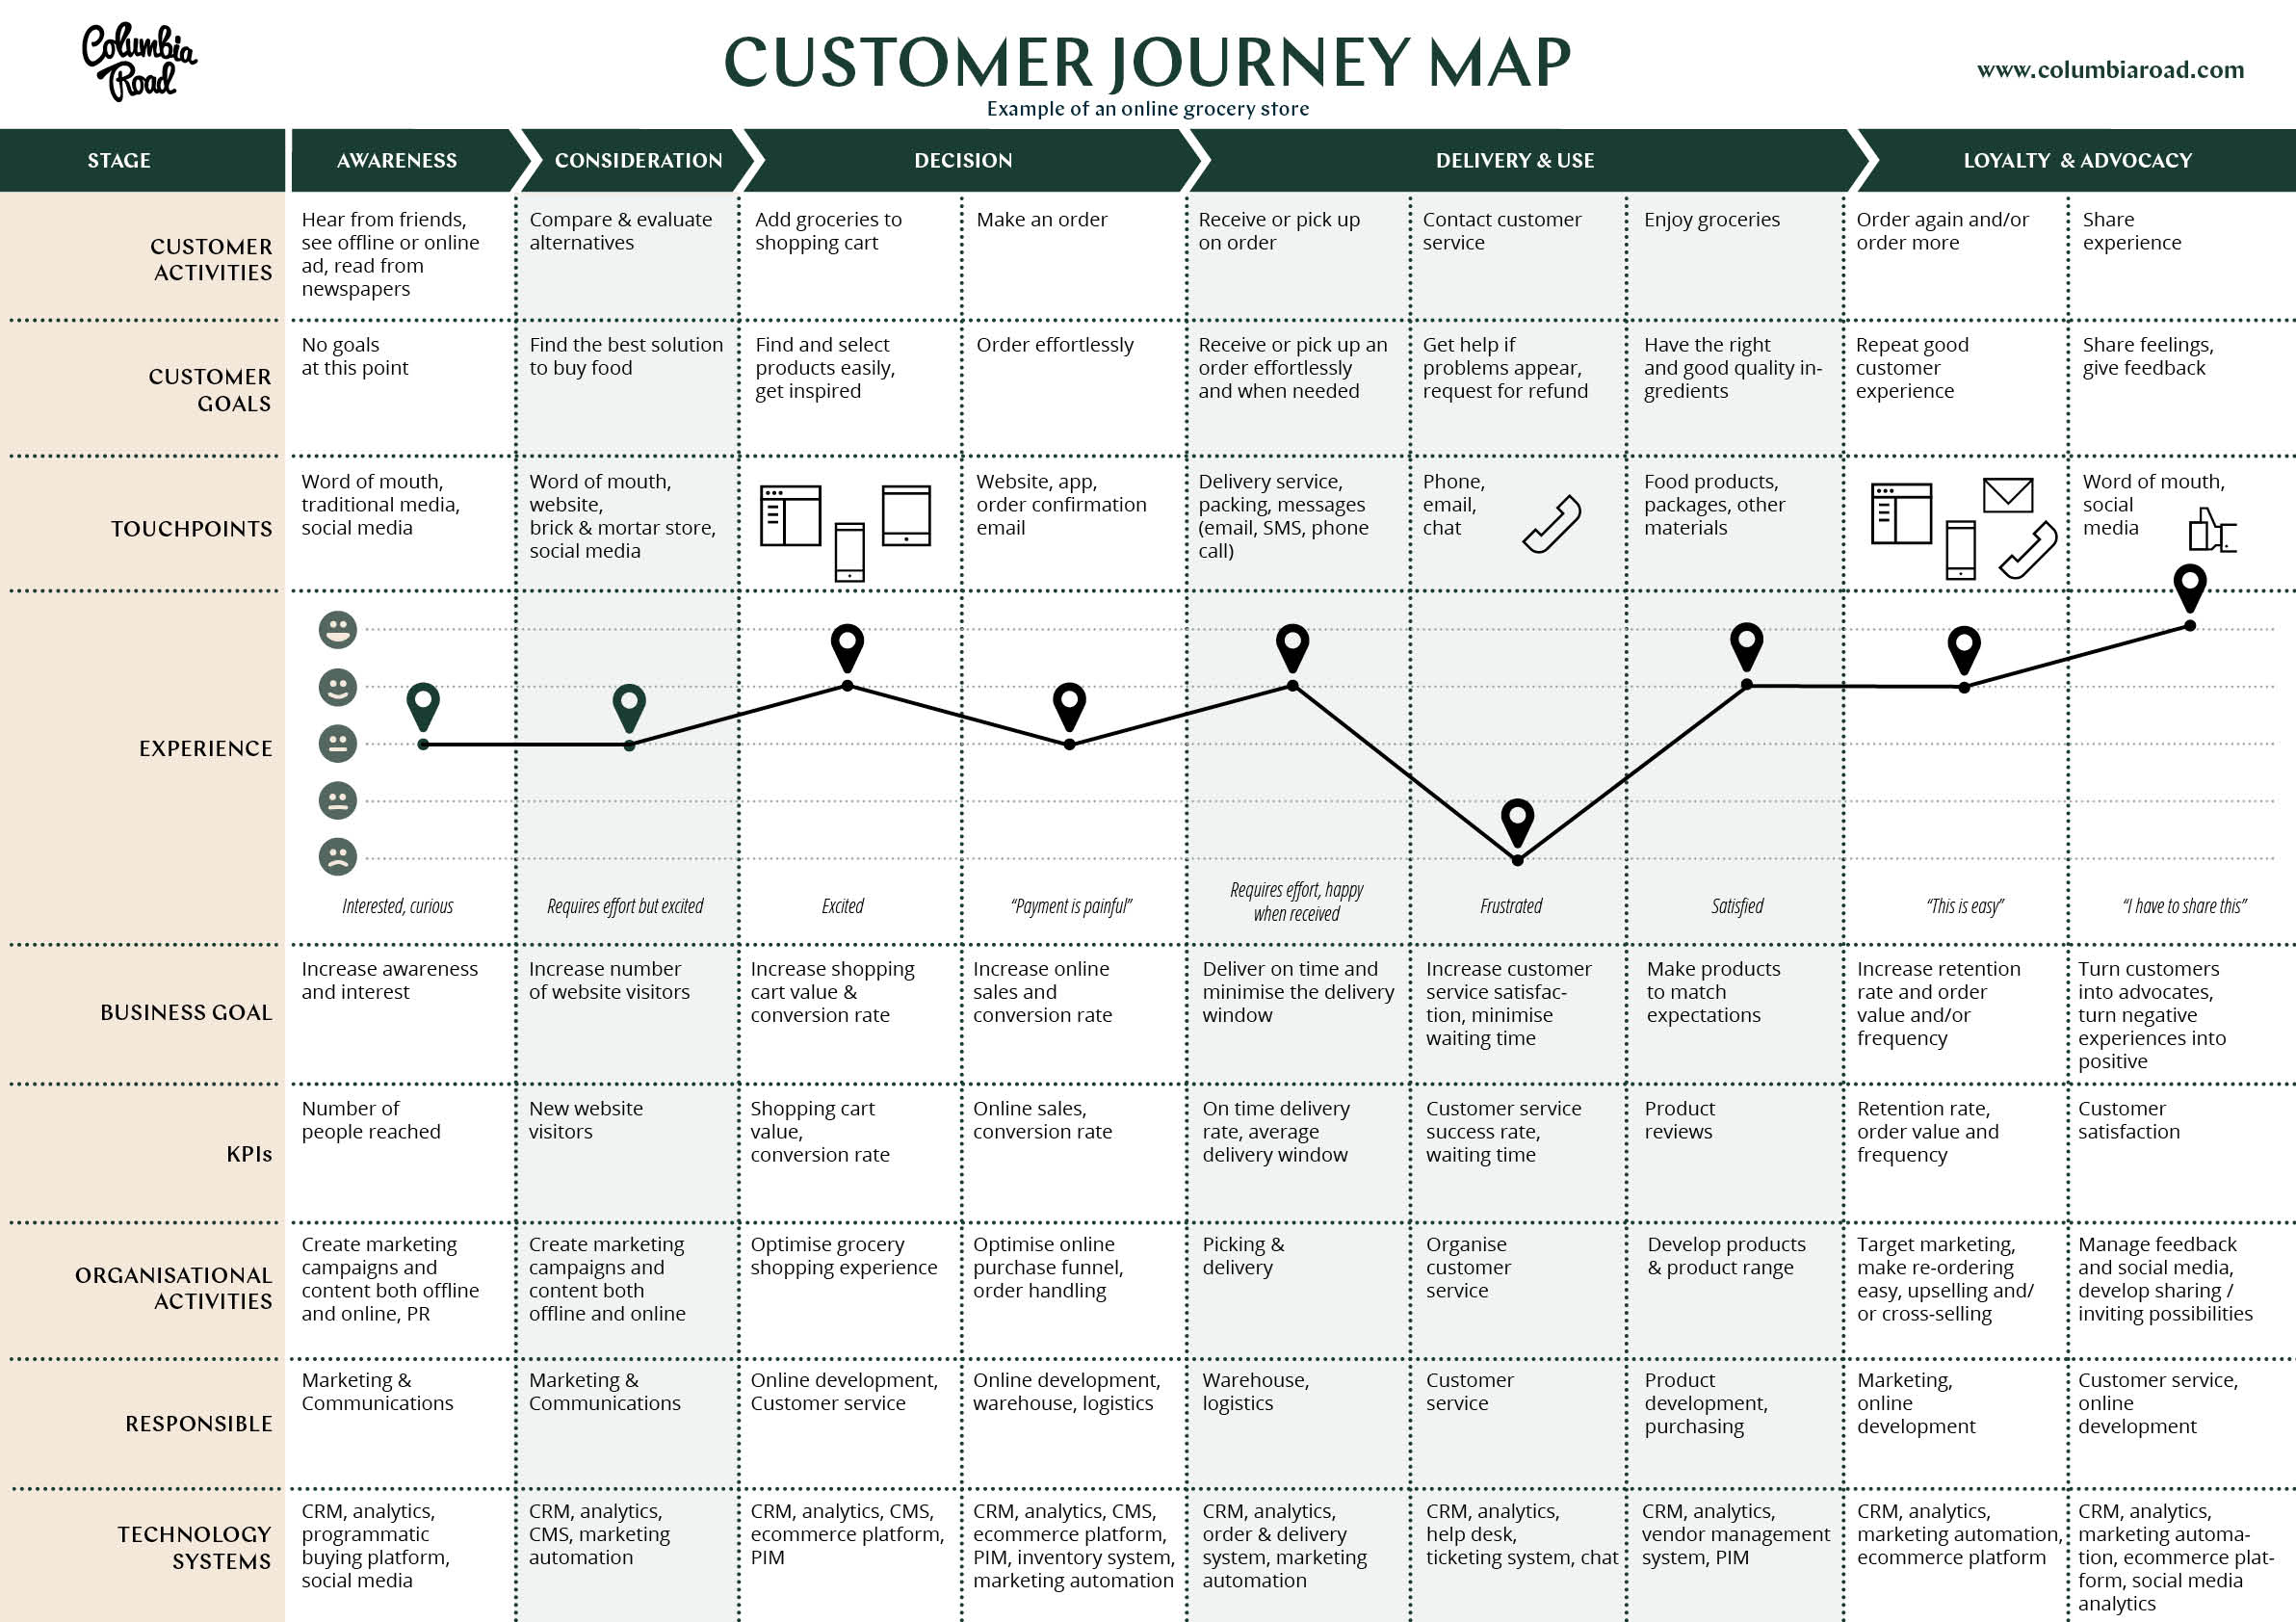
The majority of journey maps follow the same basic layout. At the top of the map, you have the user, scenario and goals this map is focusing on. Then under that, you have the actual map, this is split into phases, each with user thoughts, emotions and actions outlined. At the bottom of the map is an area for key takeaways, observations or other additional information pertinent to the map itself.
N.B. User journey map and customer journey map mean the same thing.
Why should you use a journey map?
First, the process of simply creating a journey map can align the entire team around a specific flow. A lot of organisations look at success metrics for specific parts of a flow, with no one taking the time to look at the overarching picture. Creating a shared vision within your team aligns everyone on improving the entire user experience rather than just a small snippet that they own.
Second, the journey map itself is an effective way to convey information in a way that is memorable and easy to absorb quickly. Maps can become the basis for decision making when looking for areas of a product to improve in future. Journey maps can also be used to guide decisions around the visual design of your product if during your research you unearth aspects of your customer experience that could be improved through design.
Lastly to create an accurate and effective journey map you and your team must get a deep and wide understanding of your user, their needs and goals. The act of doing this can strengthen the empathy you have for your users and can help guide you in understanding the customer.
The sections of a journey map
Journey maps can look visually quite different from one another because of branding and the style choices used however, they all should contain their basic elements:
The User Persona
This section outlines who the user is that is experiencing the journey, this could be an internal user, a customer, a new user or an admin. Personas should be based on research and data collected before creating a user journey.
The persona is there to build the narrative around the journey. For example, a project management tool may have one journey with an admin persona and another with a default user persona.
Scenario and Goals
The scenario is used to describe what tasks the journey map covers and outlines the user personas main goal or goals as part of it. For example, a scenario could be a person is coming to the end of their mobile contract and is looking to switch providers. The goal would be to find out enough information about the different tariffs on offer with your company to decide on whether or not they want to switch.
Scenarios can cover known existing journeys users take or be hypothetical for products or features that are still in development.
Journey Phases
The body of the map is split into phases, each of which covers a high-level stage of the journey. This allows us to organise the rest of the content appropriately into a linear flow. Depending on the flow you may only have a handful of stages or for more complex flows there could be many stages. For example when switching mobile providers the steps in the journey may be: research in providers, discovering a provider, understanding that providers’ offering and deciding if it is a good fit.
Actions, Thoughts and Emotions
These are additional data points that go alongside the journey phases that flesh out the story of the journey and add an extra level of depth to the flows.
1. Actions should include the actual steps takes by users, if we continue with the tariff scenario these could be ‘Googling mobile tariff providers’, ‘Navigating to the tariff section of the site’ or ‘contacting a local branch for advice.’
2. Thoughts should outline the questions users are looking to answer at each step of the journey. These could be things like ‘is this provider available in my area?’ or ‘do they have a store near me?’ These questions provide us with the users’ motivation to continue to the next step in the journey or not.
3. Emotions are usually shown as a line graph that flows across each stage and shows how the user is feeling at each stage of the process. This is a great way to highlight areas of the journey that are failing in terms of experience and can help us narrow in on where we should be concentrating efforts to make improvements.
Key Takeaways and Observations
The final section at the bottom of the experience map is an area where you can highlight the key findings from the map and any particularly important observations. Some important things to keep in mind when writing this section: What are the next steps from this map? Who is going to action these opportunities? And who are you going to be sharing this map with? This can help you frame your findings in specific ways for different audiences.
How to gather data for a journey map
Now you know the ins and outs of a journey map, how do you go about gathering data to populate it with?
Set a clear objective for your map
The first step in creating a useful user journey map is to outline what your map is going to cover, what is the goal of the map and who is it specifically about? If you already have a selection of user personas this part should be easy but if not you may need to do some work to build your understanding of the different personas that use your site or product.
Understand the journey’s steps
This is where you will need to do some research. This is usually done by user researchers but depending on your team size and budget you may need to do this yourself. You can do with via sending our surveys or by conducting interviews. The main thing is you should only be doing this with people who fit the persona for your map. The questions you ask should be tailored around the scenario of the map. For example, when trying to understand the steps a person has taken to switch mobile providers you may want to ask; Where did you first hear about our company? What attracted you to us? How long did you spend comparing providers? And how did you find the process of switching providers?
List your touch-points
From these surveys and interviews, you should be able to start building a picture of the touch-points for each stage of the journey. Some users may have slightly different paths (some may use Bing instead of Google for example) but you can abstract these small differences out when creating your final map. When you understand every touchpoint a user can take as part of the journey you can see how much external influence there is on your users’ decisions. You should also include things like ‘speaking with friends and family’ or ‘seeing an ad online’ if these are mentioned in your interviews.
Repeat this list for actions
You should repeat this list for each of the actions a user takes, this should be vaguely similar to the touchpoint but are agnostic of detail. Where the touchpoint is ‘Google’ the action is ‘Used search engine to find mobile tariff providers’.
Start building out your journey map
At this point, you can start creating the linear journey map in whatever tool you want to use. Some people like to use presentation software so it is easily sharable and others prefer to use something like Figma or Micro to make it more visual. Either way, it’s better to start creating your map at this stage because the emotions and pain points are easier to map out if you have something already in place to lay them on top of.
Create the visual of emotions
The emotions part of your map can be overlaid on top of the map or visually separate, because of this, this should be done using a line tool so you can connect each point to the next in one long flow. You can even use emojis here to make your map more human and easier to understand at a glance.
Outline your findings
At the bottom of each stage of the journey, you can outline the main findings from that stage and if any potential actions can be taken. For example, if you find that your website sits far down the Google search results you could have a key takeaway that the SEO (search engine optimisation) of your site should be improved. Or if your interviews highlighted that users want a way to contact you via the website this could be added as a key takeaway for further research.
Journey maps are a great way of synthesising a lot of information into one digestible output and are useful for team alignment, feature prioritisation, stakeholder engagement, guiding ux design and much more. Hopefully, this article helps you on your way to creating your first journey map.
Sympli is a Saas company that creates tools for design collaboration, handoff, and version control. With more than 5 years on the market, we had helped thousands of designers and developers work together by providing a single source of truth and reducing back-and-forth communications, resulting in faster delivery.